
What are the benefits of using graph analytics? - Course Monster Blog

Data is growing at an exponential rate, and increasing automation is creating a flood of data from smartphones, mobile, and IoT devices, security systems, satellite imaging, cars, and other sources. The challenge then arises, how can we rapidly obtain useful insights from ever-growing data sets of various types and sources?
Graph technology allows developers and analysts to easily get significant insights by exploring relationships and discovering connections in data. Much of the world’s data is truly linked, including financial transactions, personal and professional networks, manufacturing supply lines, and so on. Graphs show those connections instantly.
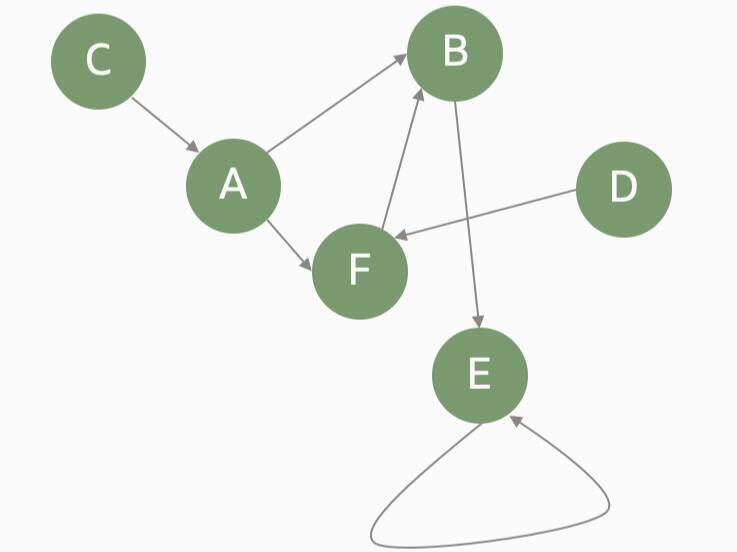
Here’s an example of how data sets are linked and how complicated analysis might become as a result of data connections.
Graph data platforms enable developers to work more efficiently. They provide the performance and scalability required for big installations, while improved query and search capabilities simplify access and reduce time to insights for connected-data use cases.
Oracle makes it simple to implement graph technology. Oracle’s converged database includes graphs, which allow multi-model, multi-workload, and multi-tenant needs in a single database engine. The strength of built-in graph algorithms, pattern matching queries, and visualization in Oracle Database and Oracle Autonomous Database enable analysts to swiftly find new insights. Graph analytics may be readily added to existing systems by making use of Oracle Database’s performance, scalability, reliability, and security.
Oracle is recognized as a leader in graph data platforms
Forrester evaluated graph data systems using 27 criteria. Graph model/engine, deployment options, cloud, app development, API/extensibility, data loading/ingestion, data management, transactions, queries/search, analytics, visualization, high availability and disaster recovery, scalability, performance, data security, workloads, and use cases are some of the main criteria.
Why graph technologies from Oracle?
The following are key features of the Oracle offering:
- Complete graph database that supports both property graphs and RDF knowledge graphs. Oracle Database makes it easier to describe relational data as graph structures. It simplifies the identification, processing, and visualization of linked data sets on-premises or in the cloud.
- Enterprise-level scalability and security. Interactive graph queries can be executed directly on graph data or on a high-performance in-memory graph server, which can handle millions of concurrent users and queries per second. Customers benefit from fine-grained security, high availability, simple management, and connection with other data sources in business applications. Oracle offers advanced multilevel access control for property graph vertices and edges, as well as RDF triples. Oracle also complies with ISO and W3C standards for representing and designing graphs and graph query languages.
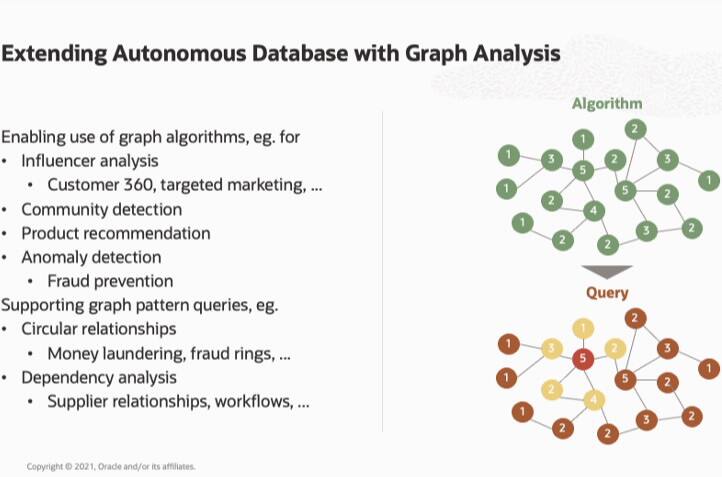
- Comprehensive graph analytics to analyze relationships using over 60 prebuilt algorithms. To generate, query, and analyze graphs, analysts can utilize SQL, native graph languages, JAVA, and Python APIs, as well as Oracle Autonomous Database capabilities. They may quickly display relationships in data to identify insights, and then publish and share analytical results using interactive analytics and visualization tools. Graph Studio in Autonomous Database allows practically anybody to get started with graphs to investigate data relationships. Graph Studio streamlines the graph analytics lifecycle by automating graph data administration and simplifies modeling, analysis, and visualization.
Graph analytics use cases
Money laundering detection in financial services: Users may develop a graph from transactions between entities as well as entities that share certain information, such as email addresses, passwords, and more, to make fraud detection easier. A single query will uncover all consumers with accounts that have comparable information, expose which accounts are participating in circular payment schemes, and detect patterns used to continue fraud after a graph has been formed.
Traceability in manufacturing: Traceability is extremely important in the manufacturing industry. A car manufacturer may have to recall a vehicle because it has a component that was produced at a facility within a specified time period. Most businesses have a production database, a retail database, a sales database, and a shipping database. Unless the business has a graph database to link all the relationships and graph algorithms to highlight connections and essential information, it is difficult to uncover all the relevant information to locate the automobiles with the problem, where they were delivered, and to whom they were sold.
Criminal investigation: Graphing data is a simple and efficient technique to detect criminal networks and search for trends. The use of graph-based algorithms makes it simpler to pinpoint specific places, highlight co-traveler links, and identify significant suspects and criminal groups. Users, for example, can determine the “weakest link,” or the vertex on which the graph is dependent, by using betweenness centrality. If you delete that vertex, the entire network may collapse, indicating that you have just discovered the linchpin of a criminal organization.
Data regulation and privacy: A graph is ideal for tracking data lineage. By tracing the edges, the many stages of the data lifecycle may be followed and browsed vertex by vertex. With a graph, it is able to trace a path and determine where the information originated, where it was copied, and where it was used. With all of this information presented in a graph, data professionals may more easily assess how to meet GDPR requirements while remaining compliant.
Product recommendations in marketing: Graph databases capture all data and connect it to deliver real-time suggestions based on client demands and product trends. Many major organizations rely on graph analytics to generate product recommendations since the linkages are already defined and the analysis of these relationships to provide suggestions is quick. Graph analysis may also uncover trends that expose trolls, bots, falsely boosted reviews, and information that may bias marketing analysis.
Summary
Graph technology facilitates the exploration of relationships and the discovery of connections in data. Pattern recognition, classification, statistical analysis, and machine learning may be applied to these models by users, including non-technical ones, allowing for more efficient analysis at scale against huge amounts of data.
Here at CourseMonster, we know how hard it may be to find the right time and funds for training. We provide effective training programs that enable you to select the training option that best meets the demands of your company.
For more information, please get in touch with one of our course advisers today or contact us at training@coursemonster.com


Comments ()